Basic Google Analytics Reports for E-Commerce
- Updated on 7 February 2024
- 2 min read
- Premium feature
Google Analytics (GA) is a free analytics tool offering insights into customer behavior and sales trends. By analyzing performance data from your Big Cartel shop, you can make more informed decisions about your sales and marketing strategies and boost the success of your online store.
Even though the new version of Google Analytics, Google Analytics 4, is more user-friendly than its predecessors, it can be confusing at first. This guide will give you a starting point for some of the out-of-the-box reports that are super useful for e-commerce websites and a great way to get familiar with the kind of data you can see in GA.
Advanced Google Analytics is a premium feature and is only available to Diamond sellers. To set up your Diamond store with Google Analytics, read this guide.
Not a Big Cartel seller … yet? Check out what our plans have to offer.
The Basic Reports
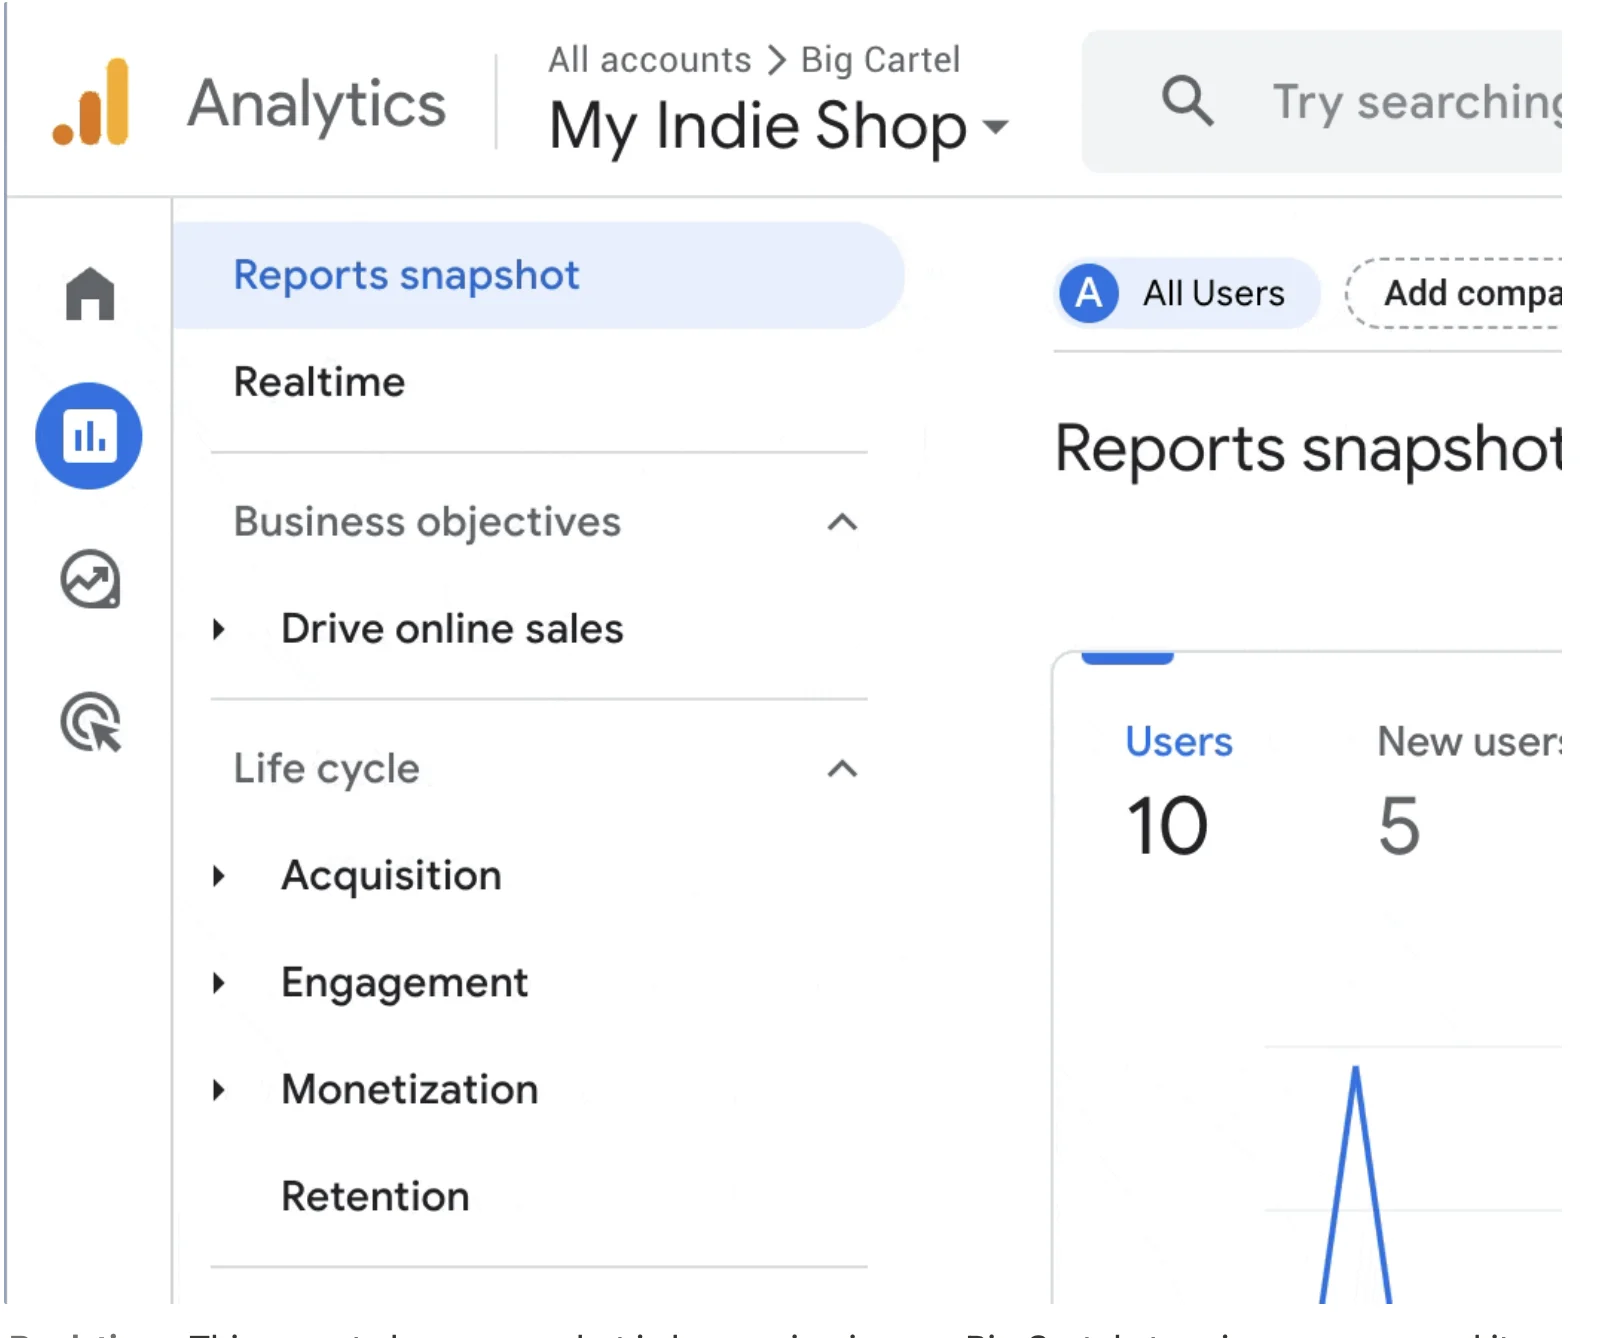
You can find the Reports tab in the left sidebar under “Reports”.
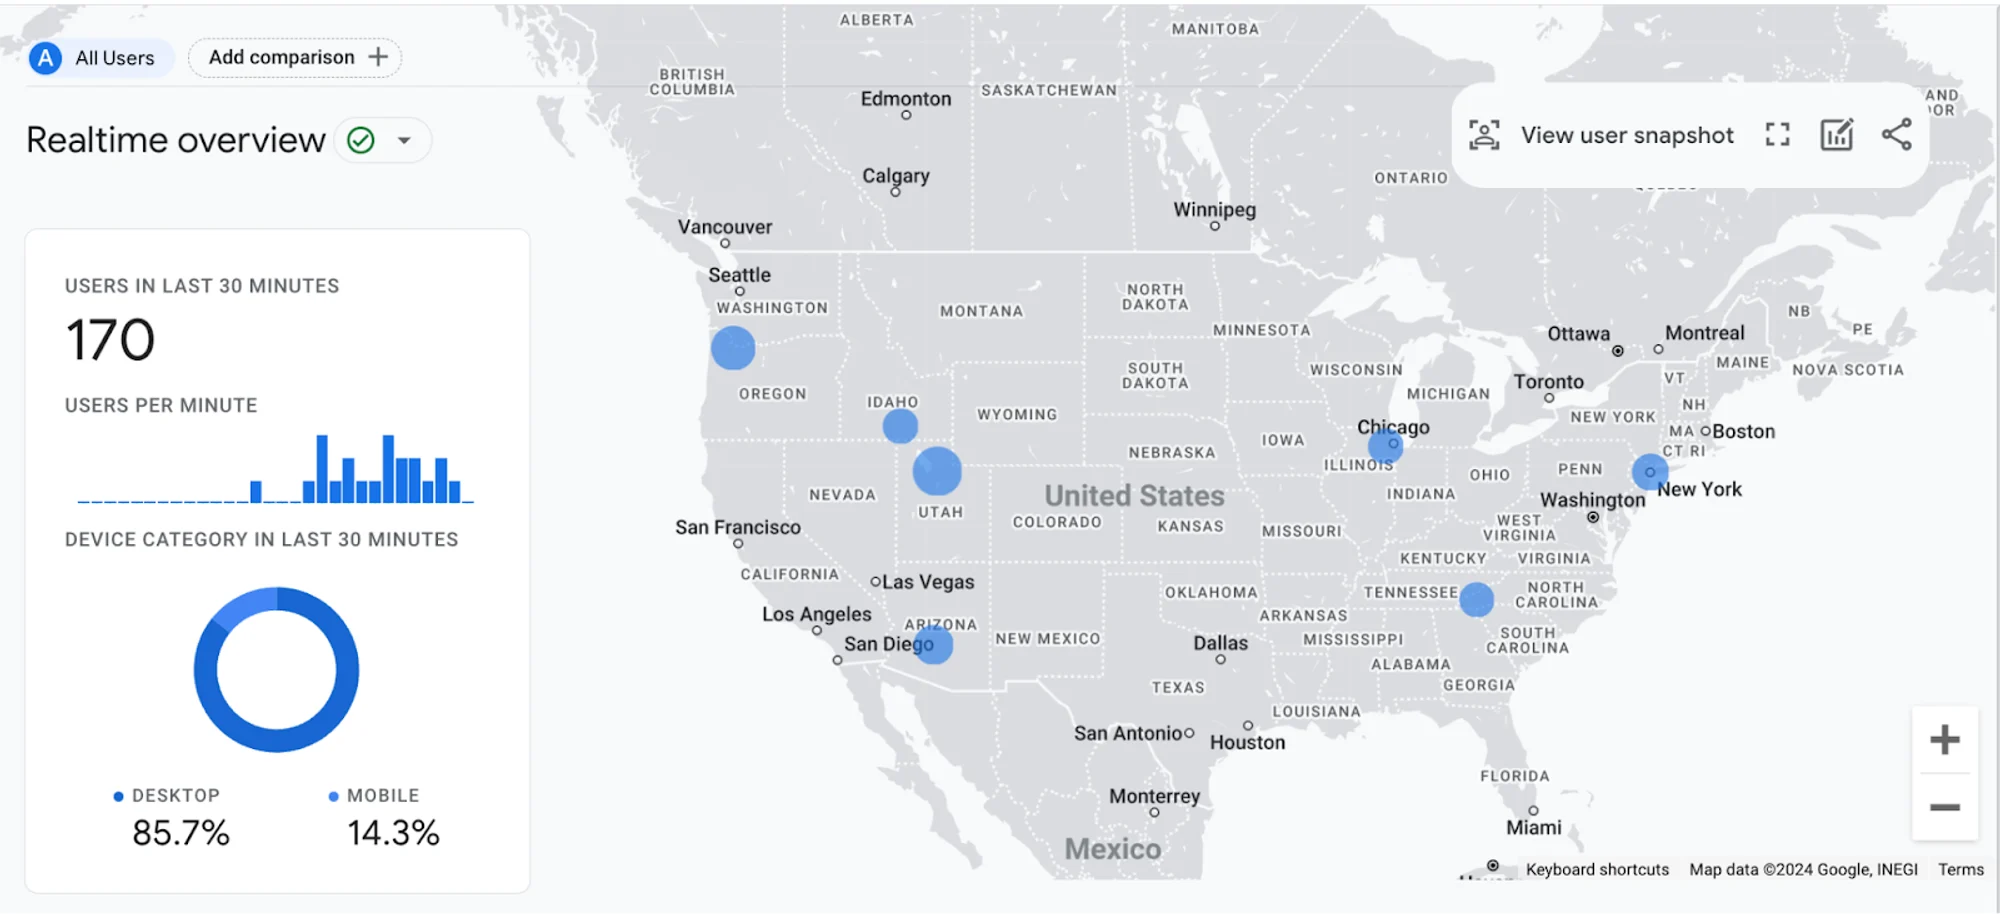
Real-time: This report shows you what is happening in your Big Cartel store in—you guessed it—real-time. It includes information on the number of users currently active, the pages they're viewing, the events they’re triggering, and the source of your traffic.
Lifecycle
The Lifecycle category helps you understand the customer journey, from first discovering your store to engaging with it and making a purchase. It's broken down into four buckets:
Acquisition: How users get to your store by channel, medium, campaign, and other sources. This report helps you understand which channels are working the best to attract customers and where there’s room for improvement. Read more about this report

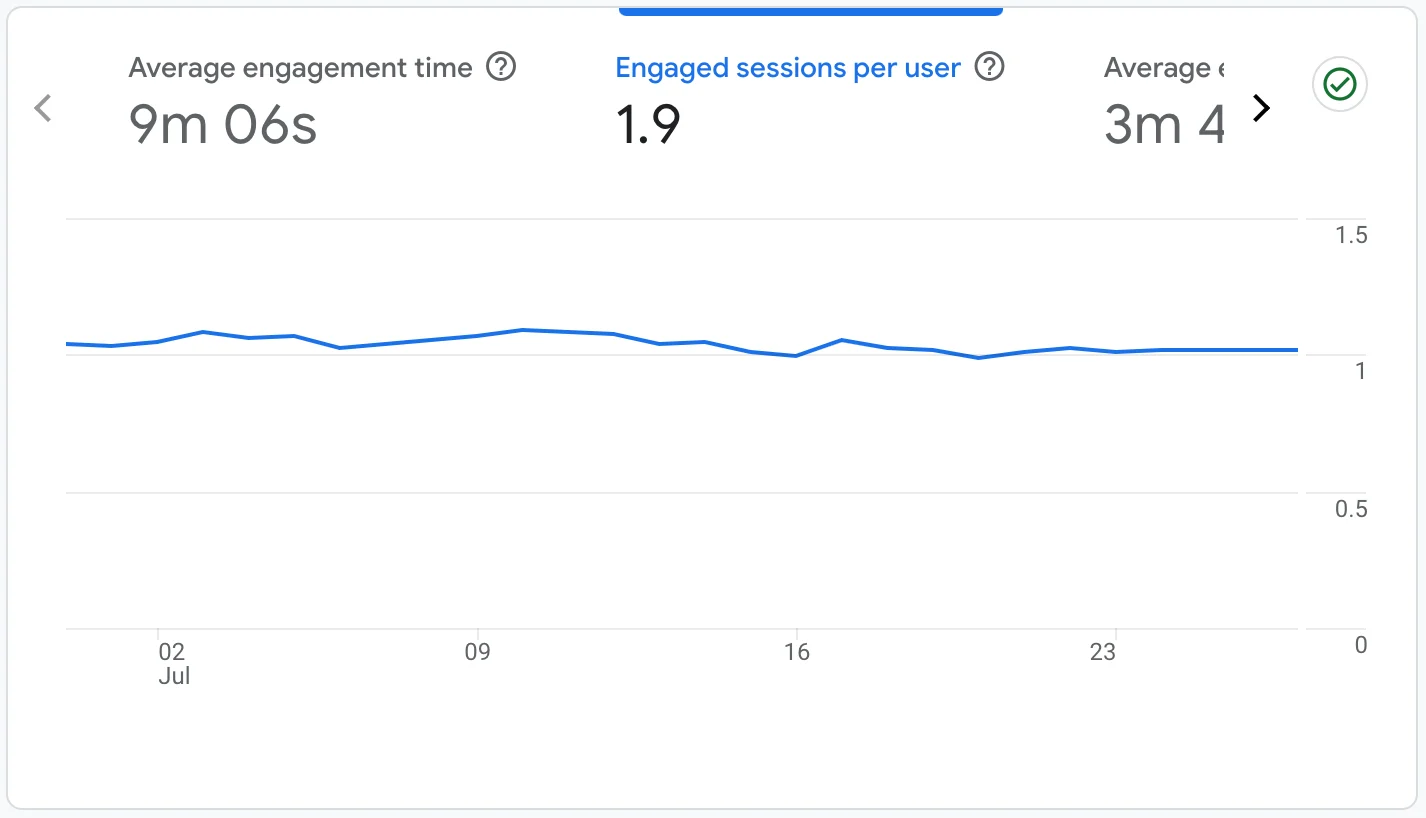
Engagement: Offers insights into how users interact with your site or app. This includes data on page views, events (such as clicks or interactions with elements), and session data. The engagement reports help you identify what content interests or engages your audience.
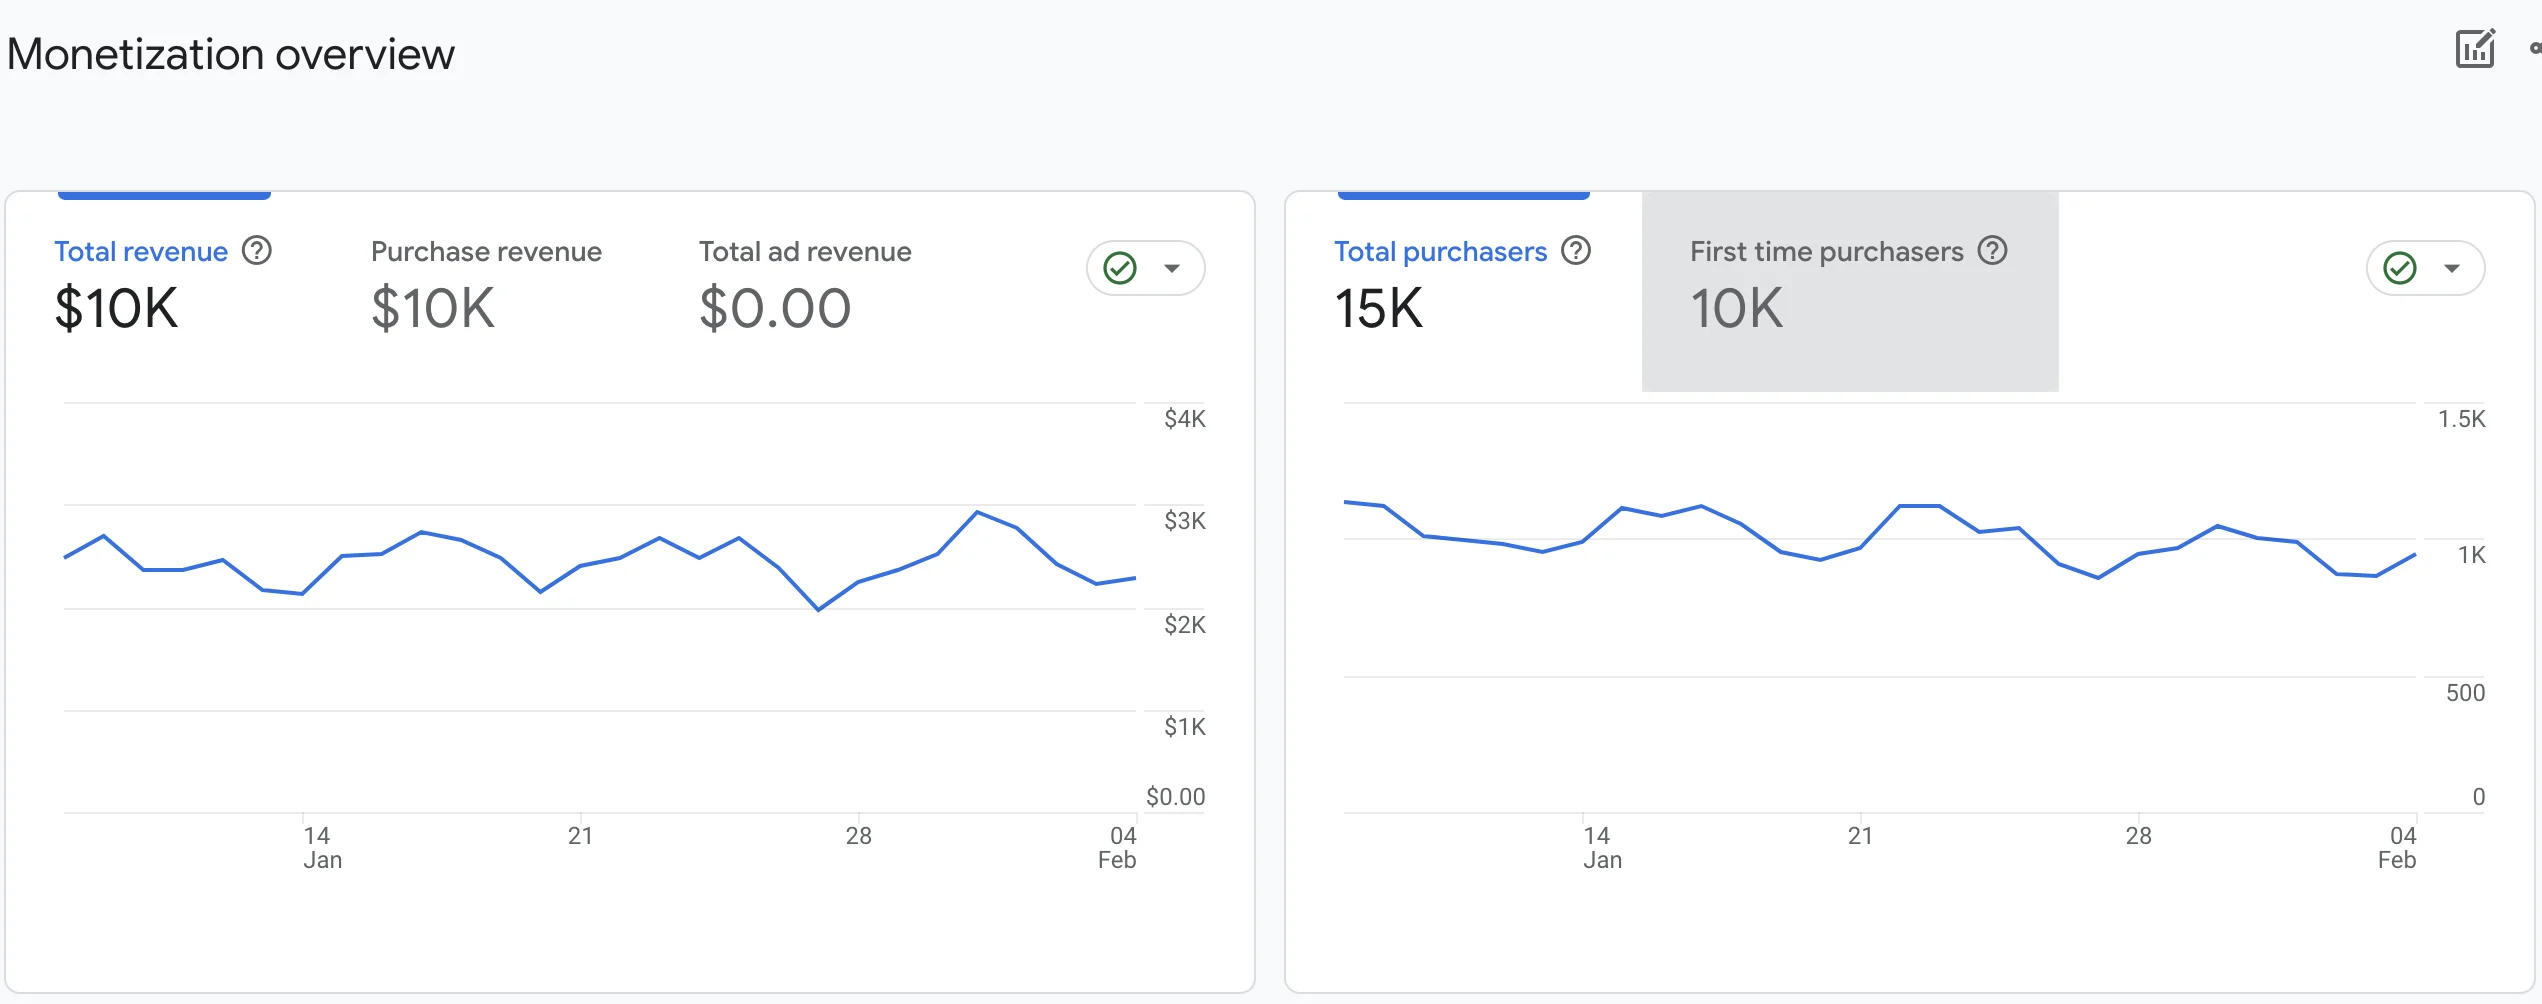
Monetization: This is where the magic happens, specifically for e-commerce folks. Here you can see how your Big Cartel store is making money. This includes detailed information about the specific products you’ve sold, helping you understand which products are most popular, how often they get added to a cart, and which items are driving the most sales.
Retention: This report provides information on how your store keeps users coming back over time and gives an overview of the engagement and buying behavior of these visitors.
User
The User category offers insights into the demographics and behavior of your users:
User Attributes: Aggregated data about users that you can analyze across various reports, including demographics (age, gender), interests, and other characteristics.
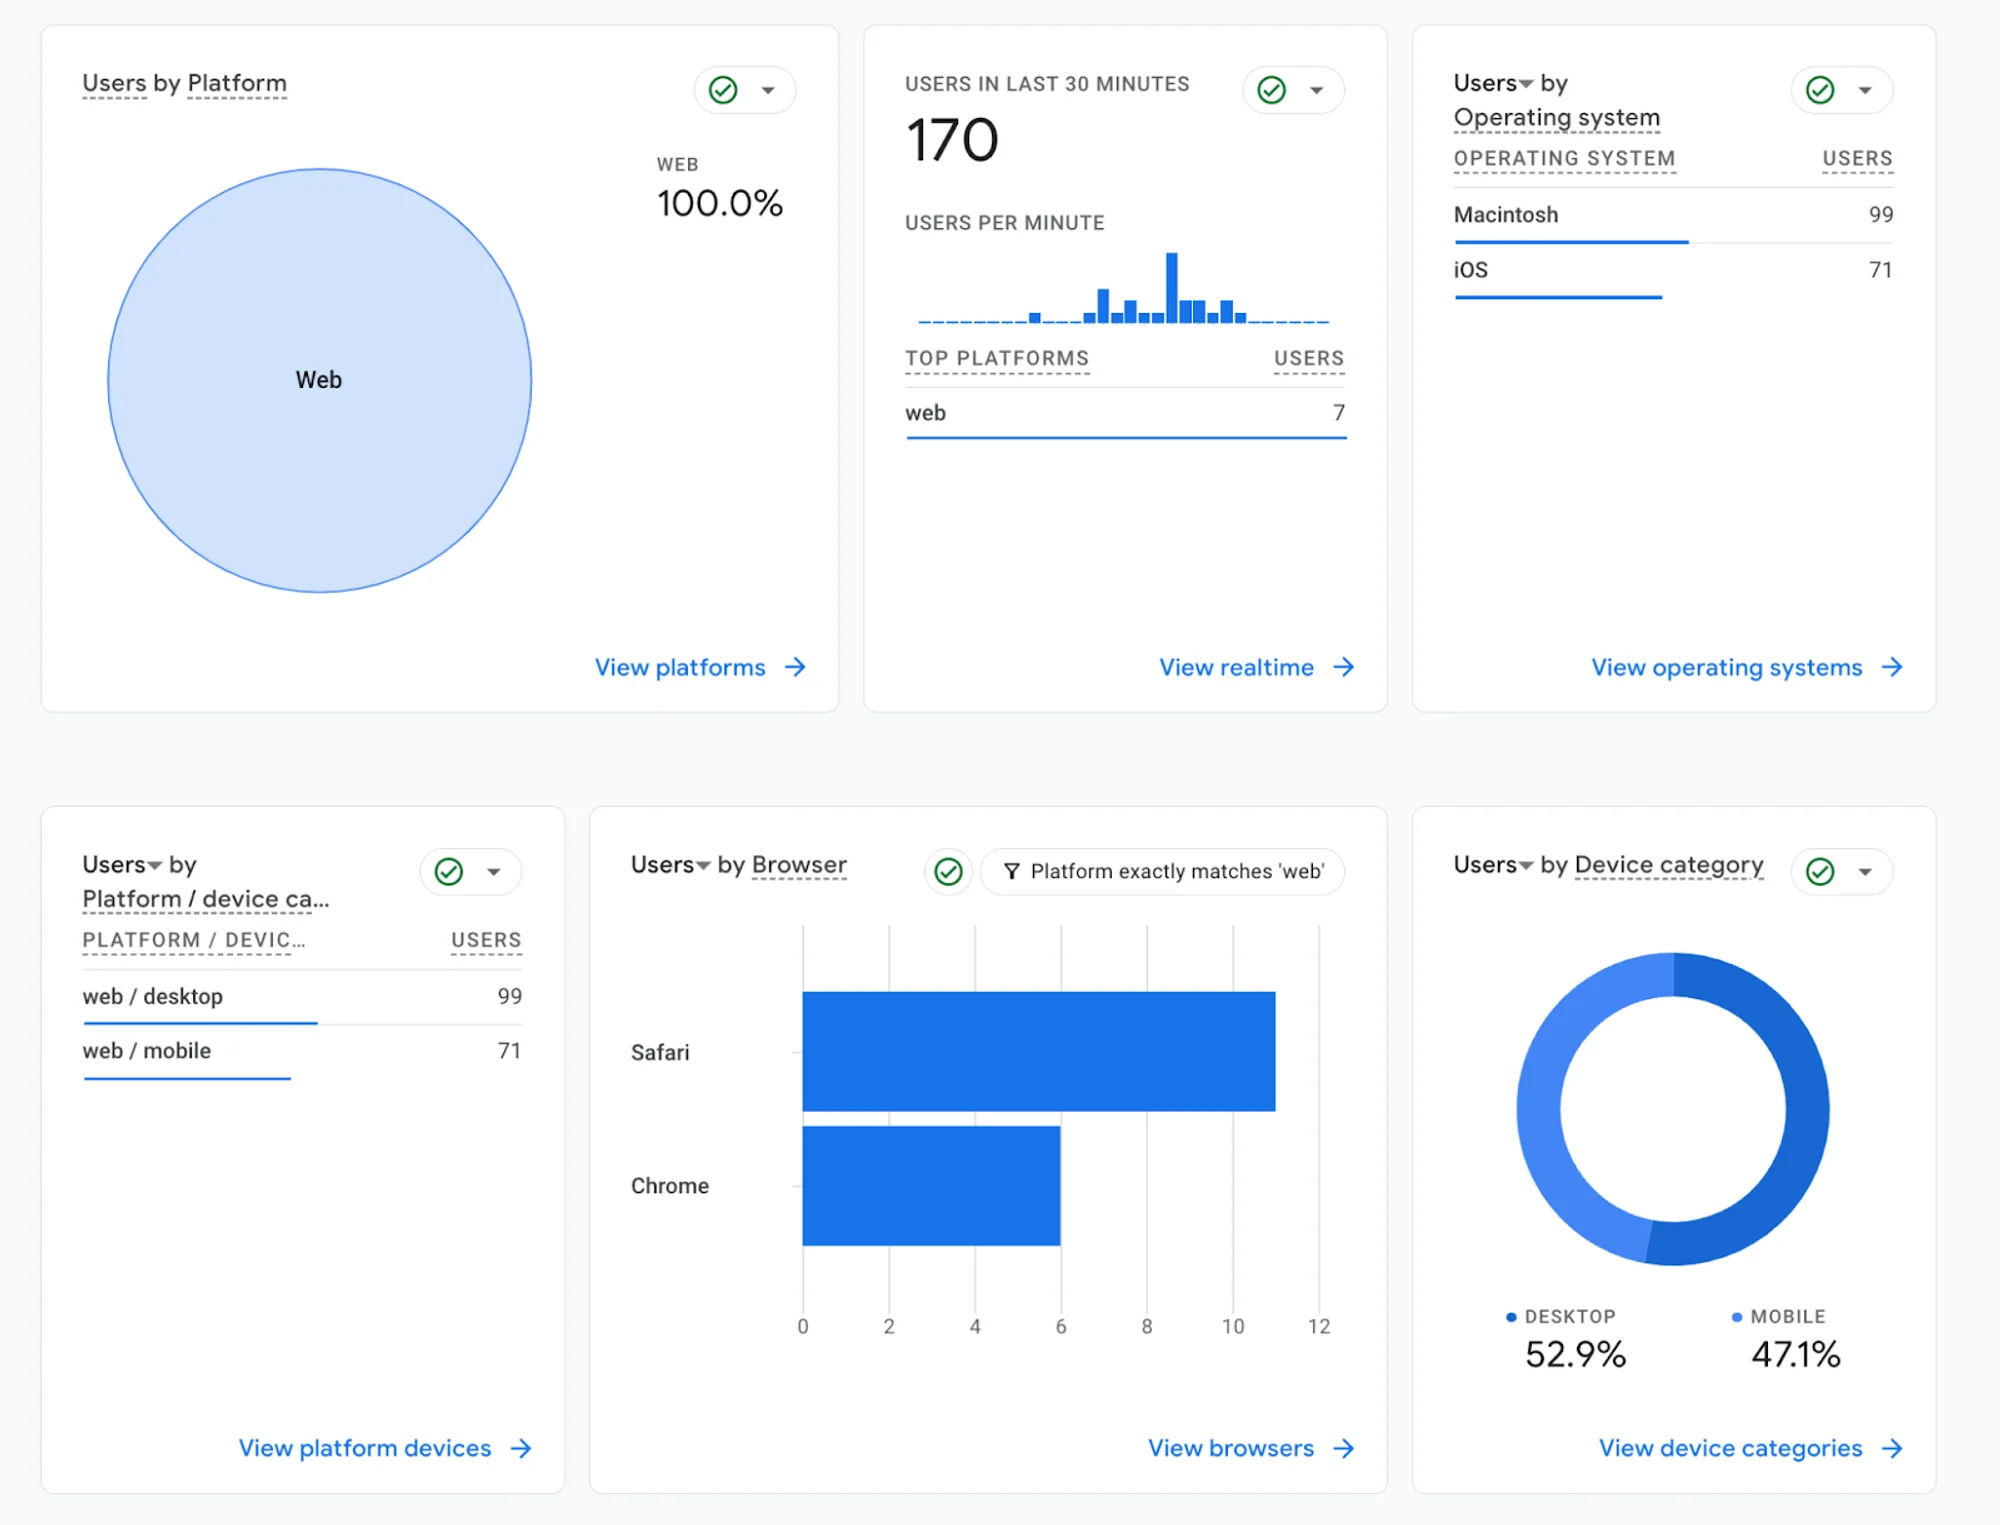
Tech: Provides data on the technology your customers use to visit your Big Cartel store like device type and browser. This information helps you optimize your shop’s performance and user experience across different devices and platforms.
The beauty of Google Analytics is that it has virtually unlimited options for creating reports. The good news is you don’t always have to build your own — which is especially nice if you are just getting started with e-commerce analytics for the first time. If you’ve already connected your Big Cartel shop to your Google Analytics account, we encourage you to get in there and click around in all the reports we’ve outlined in this guide. Getting your hands dirty is the best way to learn!