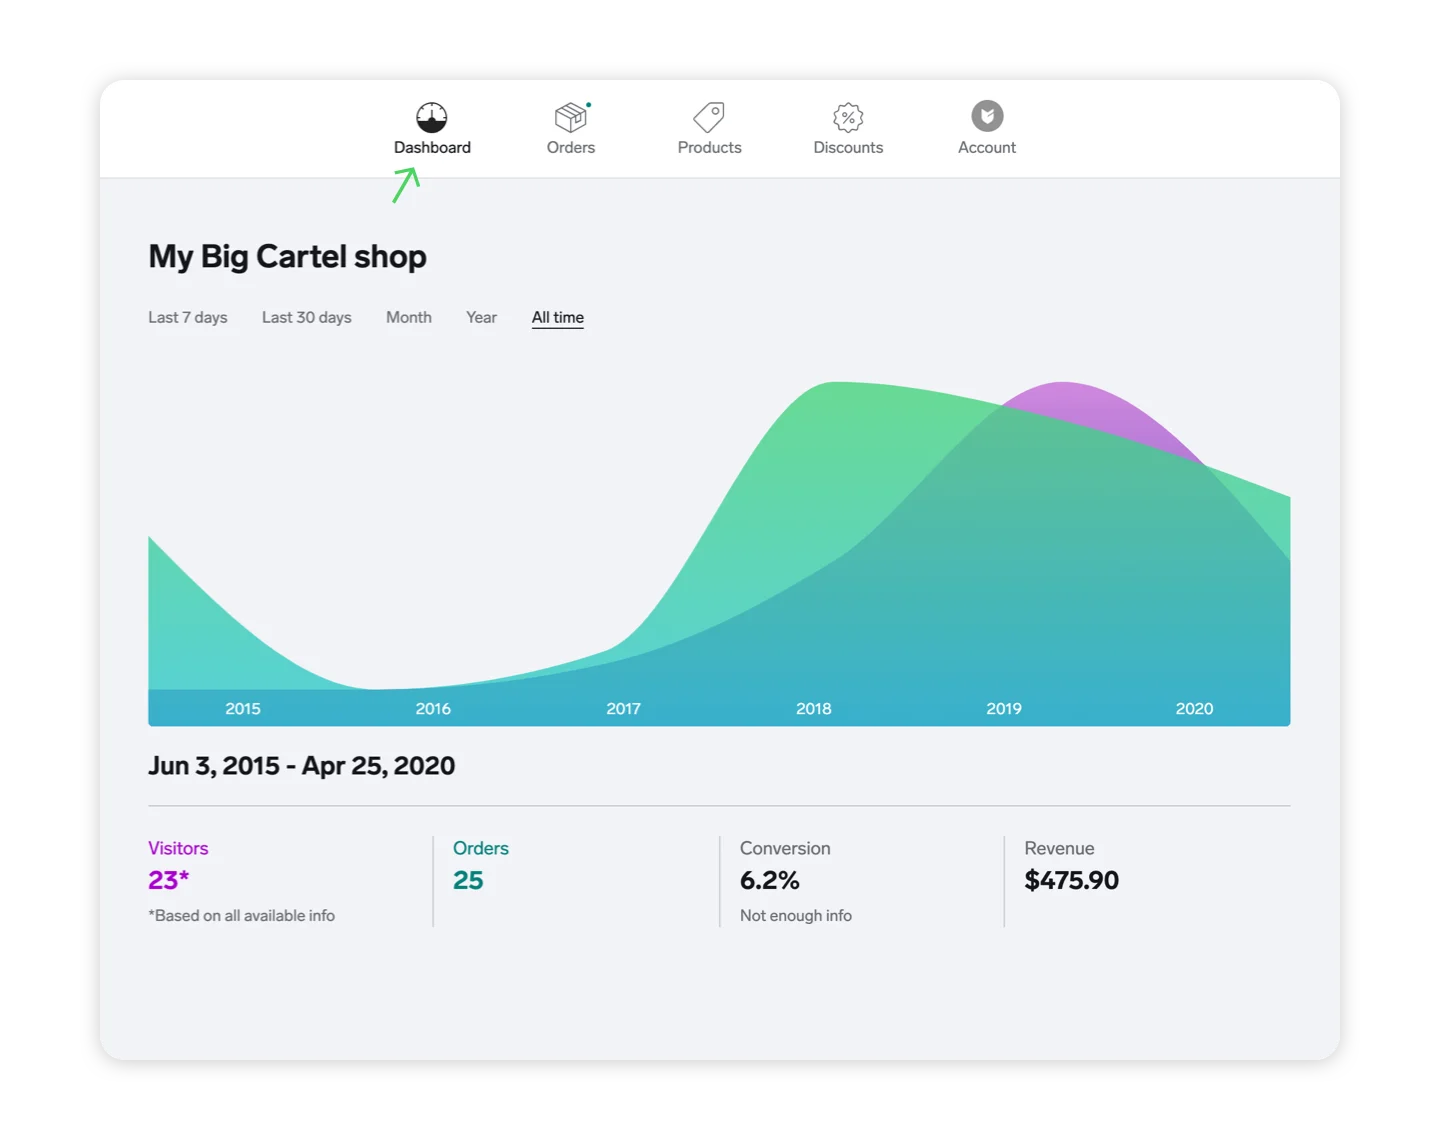
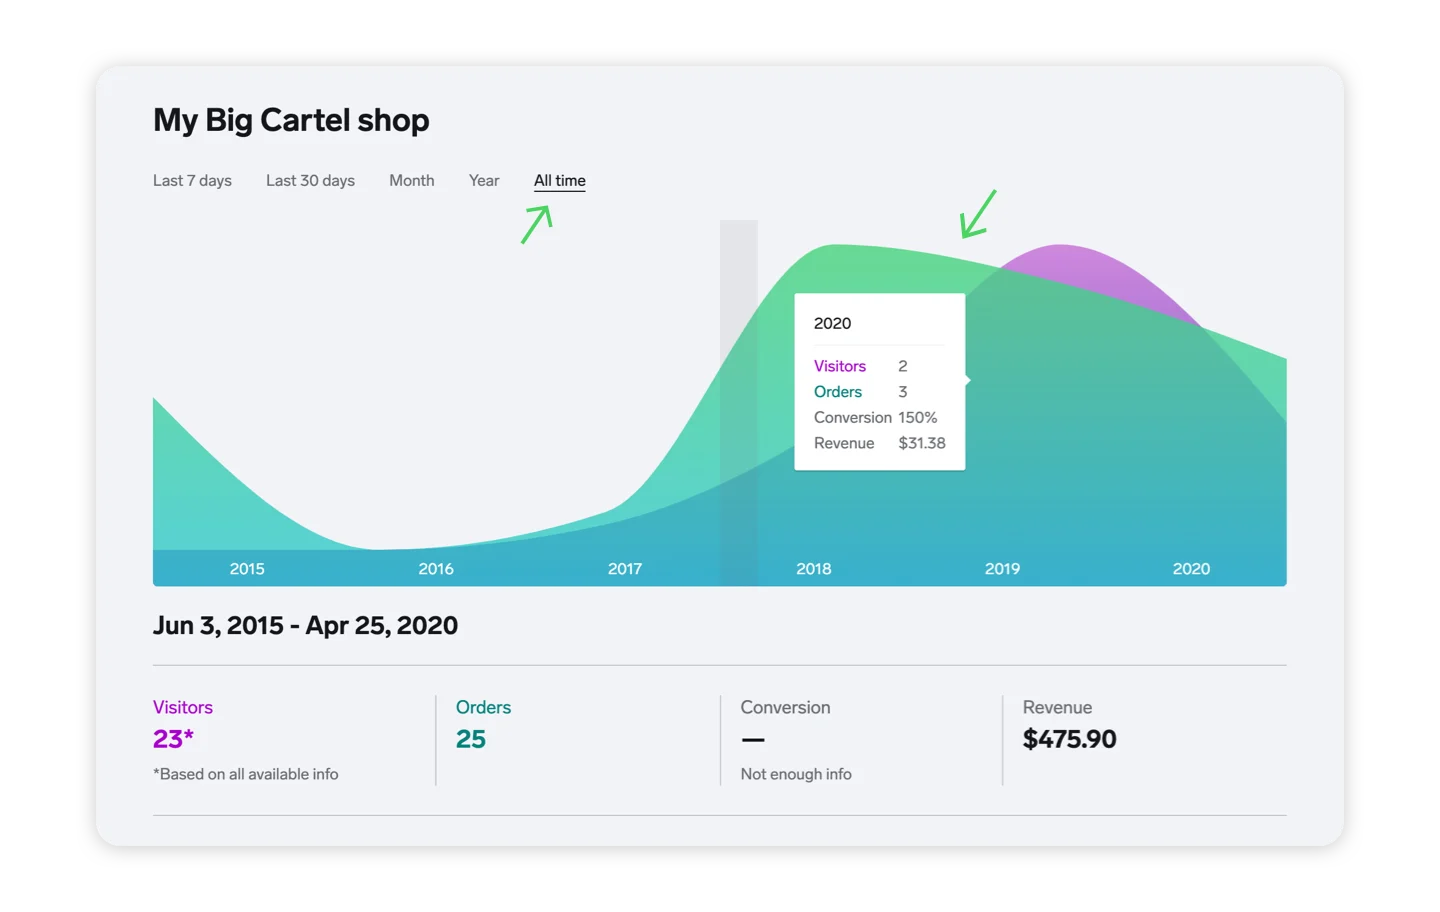
The Dashboard is where you can see up-to-date sales and visitor stats for your shop.
Here you can view all kinds of data to help you understand how your shop is doing. How many people are visiting but not buying, for example? What's your most popular product? Did that email blast pay off with a spike in sales? Now you'll know.
📊 So, what's the graph all about?
The blue-green areas on the graph represent orders placed in your shop, and the purple shows visits. You can see hard numbers for both visitors and orders on the right-hand side of the graph as well. Both unique and repeat visits are counted.
Heads up! Visitors aren't tracked while your shop is in maintenance mode since shoppers won't be able to access your storefront. We don't want to skew your conversion rate.